Mosaic Math
A wide array of the Antioch Mosaics consist of geometric and patterned designs. For my research project, I am interested in exploring these compositions in a mathematical context, following questions including: what mathematical knowledge did the Romans in Antioch know and display in the mosaics at the time? What deeper patterns can be observed across several mosaics? Since this is a broad topic, I decided to focus specifically on the Twisted Ribbon pattern, often observed in the borders of the ancient Antioch art.
For initial concept development and research, I started with the Leopard and Goat mosaic, a 5th century piece currently located in the Baltimore Museum of Art. Beneath the main scene lies the Twisted Ribbon pattern sinusoidally traversing across the border. On the decreasing portions (where d/dx(sin) < 0), the ribbon is shaded green/blue on both the top and bottom thirds of its height and white in the middle. The increasing portions (where d/dx(sin) > 0) are the same design but with red/brown tones. Beneath every peak and above every valley of the wave are yellow fruit or vegetable shaped objects across a dark background.
In the online graphing program Desmos, I first tried to model the side of the ribbon closest to the viewer. Plotting points that can vertically drag, I moved each into position in the center of the white tiles at x=0.25 intervals. Further analysis showed that this arrangement is not well fit by a sinusoid, but rather half circles joined together at their widths.
Next, I plotted points in the same fashion at both the top and bottom of the twisted ribbon’s projection onto the 2D mosaic. The height of the twisted ribbon on the mosaic (found by subtracting top and bottom) is close to a sine function, but not perfect. What is interesting is finding the centroid of the area at each 0.25 x interval: Middle = Height/2 + Bottom. Plotting these points in MATLAB, as shown in the figure below, we see a nice fit for the function f(x)=1.138sin(0.936x+2.292) at RSquared = 0.938 (the function accounts for 93.8% of the trend) of the plotted point.
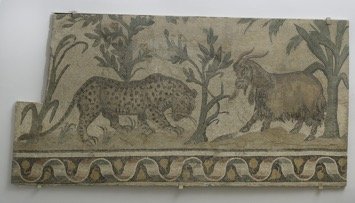
Leopard & goat mosaic; 5th century CE; Baltimore Museum of Art

This implies that there may be deeper meaning behind the function governing the pattern of the twisted ribbon.
The next steps in this project include:
3 dimensionally constructing the ribbon and “unraveling” it to visualize its pattern
Researching the development of the sine function and other historical uses throughout the Roman period
Compiling a set of mosaics with the Twisted Ribbon pattern to study and compare
Categorizing the different types of Twisted Ribbon borders in the mosaics
Alex Klein